trying to beat an old market volatility model
I learnt recently that market volatility is surprisingly predictable. It’s very much unlike the price of a security, because you’re only trying to predict if a wild market stays wild or a calm one remains calm.
There’s a model that does this for realized volatility (the annualized standard deviation of the log returns over a certain period). Its called a HAR model, or Heterogeneous Autoregressive model, made by a guy called Fulvio Corsi. Did I know all of this stuff? Absolutely not, but I spent the weekend using Claude to figure it out and it seemed kinda interesting.
It’s absolute basic function is to estimate the RV for the next 21 days like this:
future rv = c + β_1 * RV1 + β_2 * RV5 + β_3 * RV21
Estimate the volatility using by using the different weights (betas) for realised volatility for the past 1, 5 and 21 days of trading activity in the market. Standard linear regression
There’s also an index called the VIX. It shows the predicted volatility for the S&P500 Index Options for the next 30 days. This is owned by CBOE. This is what we I used to compare what HAR predicted.
How did I train the HAR Model?
I used the ordinary least squares (OLS) model from pip statsmodels to get the weights for the beta values. What was my testing data? The same RV values but shifted by 21 days. So for example, the RV for March 1 will have the observed RV values over the past 21 days, but when i shift the whole dataset by 21 days, March 1 will now hold the value March 21 did. And what did March 21 hold in the first place? The RV for the days from March 1 to March 21. So after the shift, March 1 now holds the RV that the market saw in the next 21 days. Perfect to use as my testing data.
| Parameter | Timespan | What does it tell us? |
|---|---|---|
| RV 21 | Past 21 days | The realised volatility for the last 21 days |
| RV 21 FWD | Next 21 days | The actual realized volatility seen in the next 21 days |
How did HAR do vs VIX?
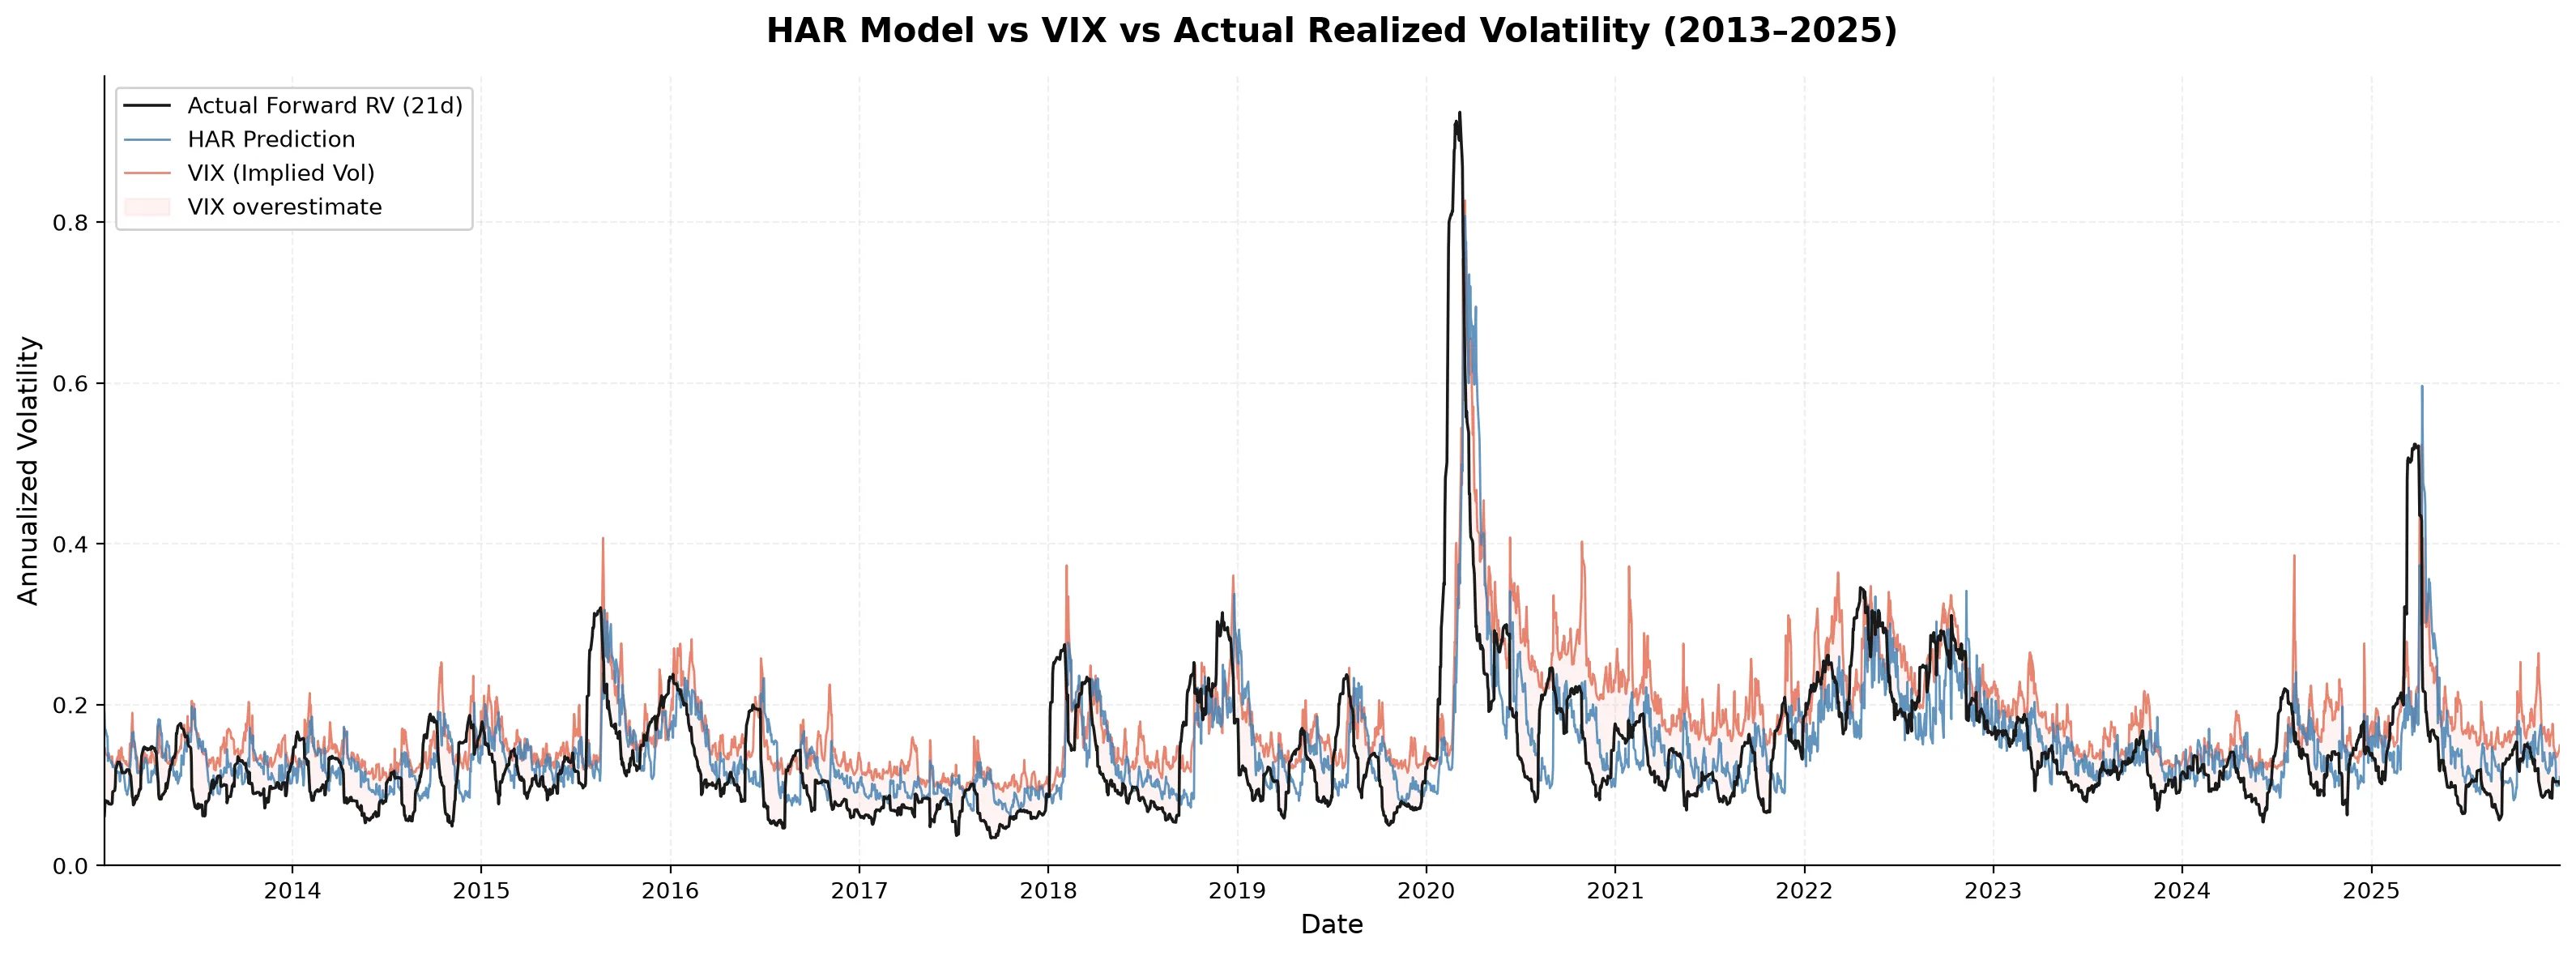
Pretty good. HAR was closer to the actual value (RV FWD) than VIX, consistently. VIX constantly overestimated the prediction, which tells us that the buyers are paying for a fear premium, better known as - Volatility Risk Premium (i.e the difference between VIX and actual) - which is a well-known fact.
Training over multiple years
I used the same logic but used multiple years of training to predict the next year. So data from 2005-2012 became training data to predict 2013, and so on until the last full year of data that I was able to get. Going forward, I decided to use the RMSE (Root Mean Squared Error) to find out how good/bad the models I trained were getting based on the changes I made on them.
Adding some ML in the mix
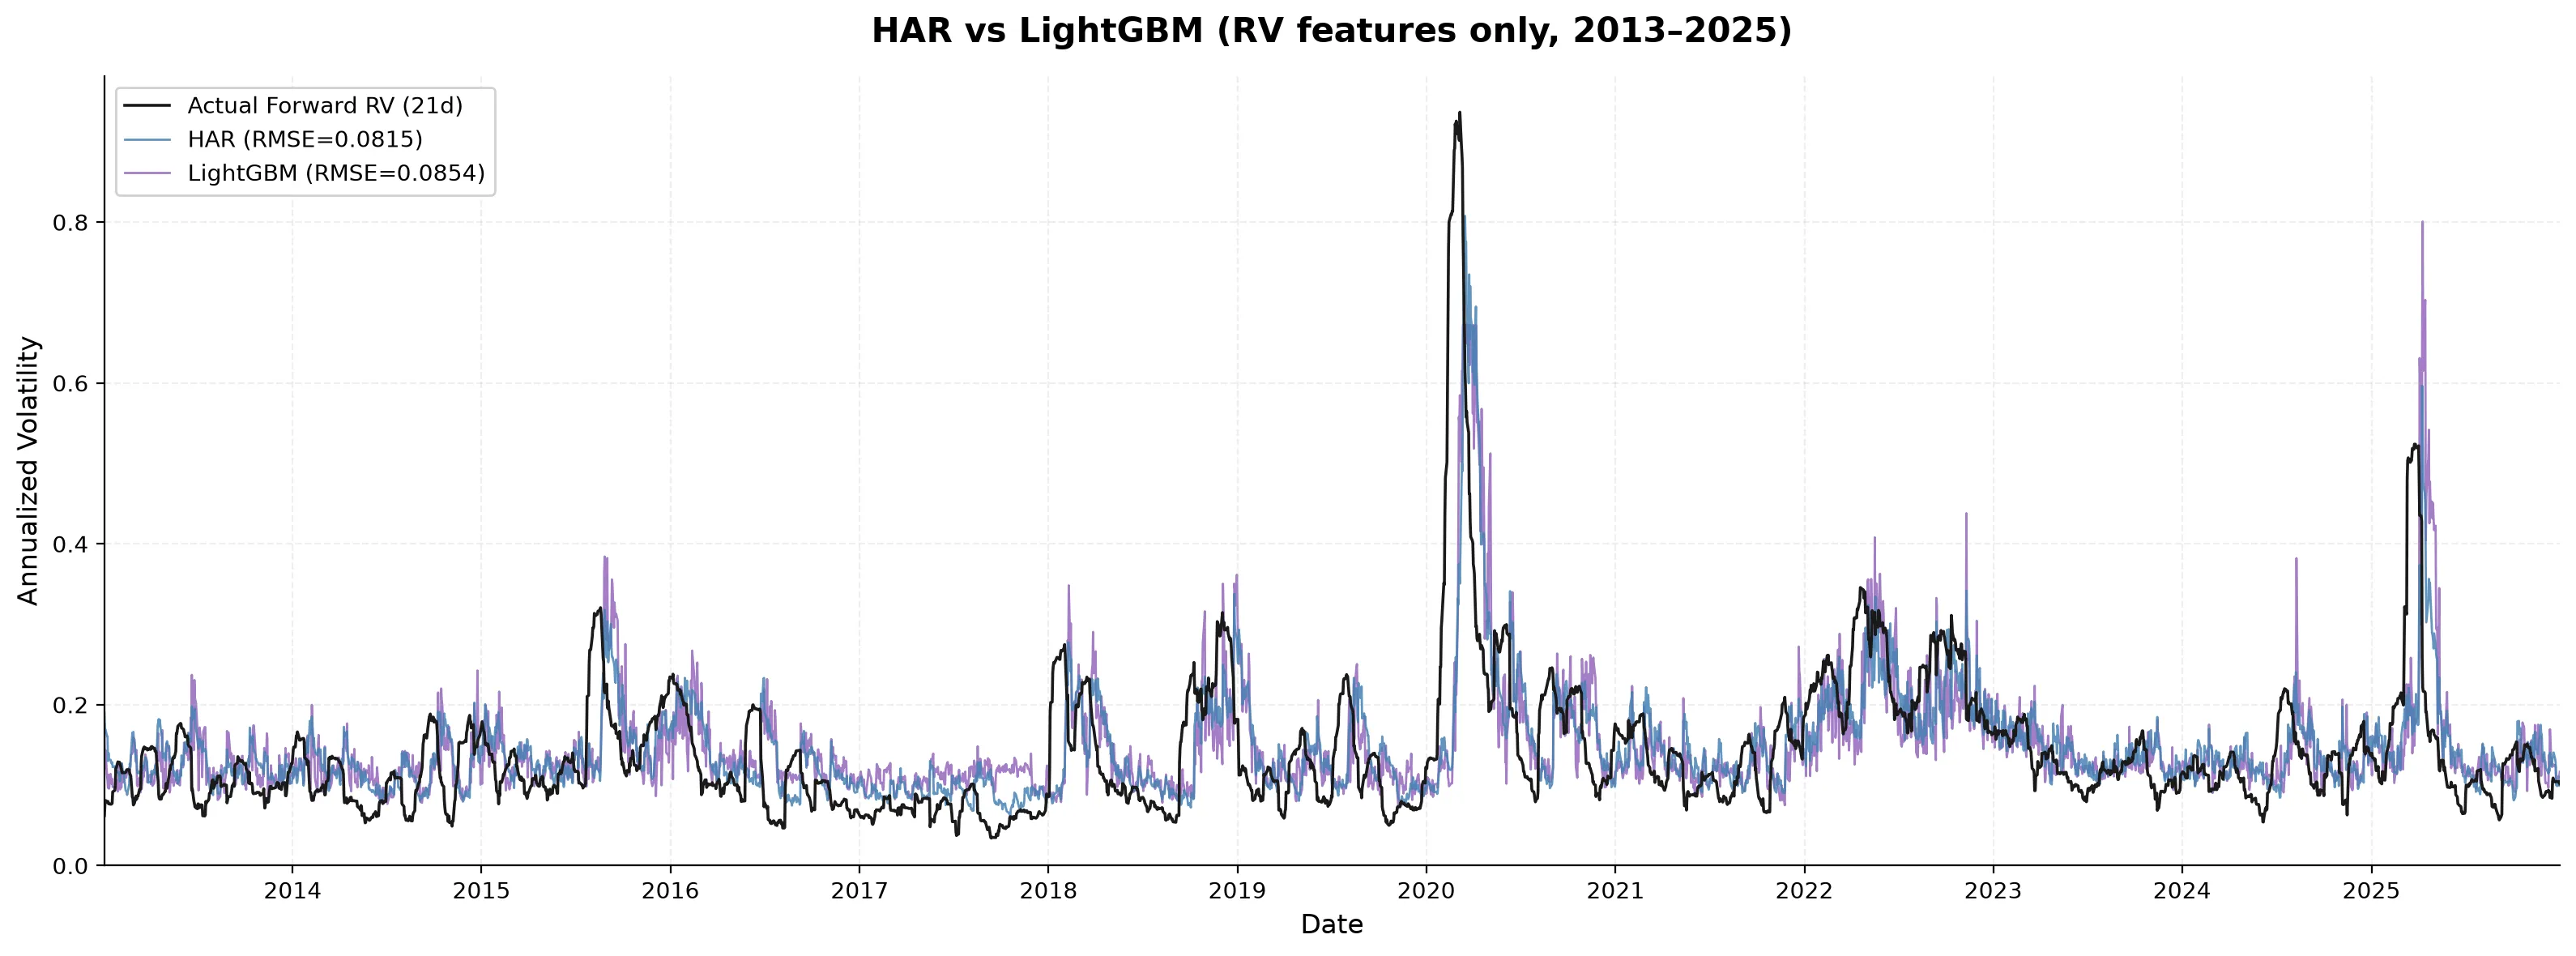
I tried using LightGBM, a tree based gradient boosting framework. What parameters did I use? Well initially I only used the same ones I passed into HAR, the three RV values (for 1,5 and 21 days), and the results were, well, not that great.
| model | RMSE |
|---|---|
| lgb | 0.0854 |
| HAR | 0.0815 (better) |
Then, on chatting with Claude, I figured it would be better to use more features in the LGB model as 3 was too less to beat the HAR. So I picked the VIX value for that day and the VRP (the fear premium we were talking about).
Did you notice the mistake I made here?
Neither did I when I made it. I noticed an RMSE value of 0.012 for the LGB model now, strange, how did adding 2 parameters make the result so accurate? The mistake I made was giving it the VRP. If you remember, the formula for VRP was:
VRP = VIX - RV_21_FWD
Boom. I was passing in the exact value that I was trying to predict, real smart huh. Me (and Claude) were quick to find the mistake, and I took out VRP as a parameter. And surprise, it beats the old HAR values that I had.
But another question arises now, was it really a fair playing field? HAR only had 3 parameters while I gave VIX 4. What if I passed VIX into the HAR model as well?
HAR-X
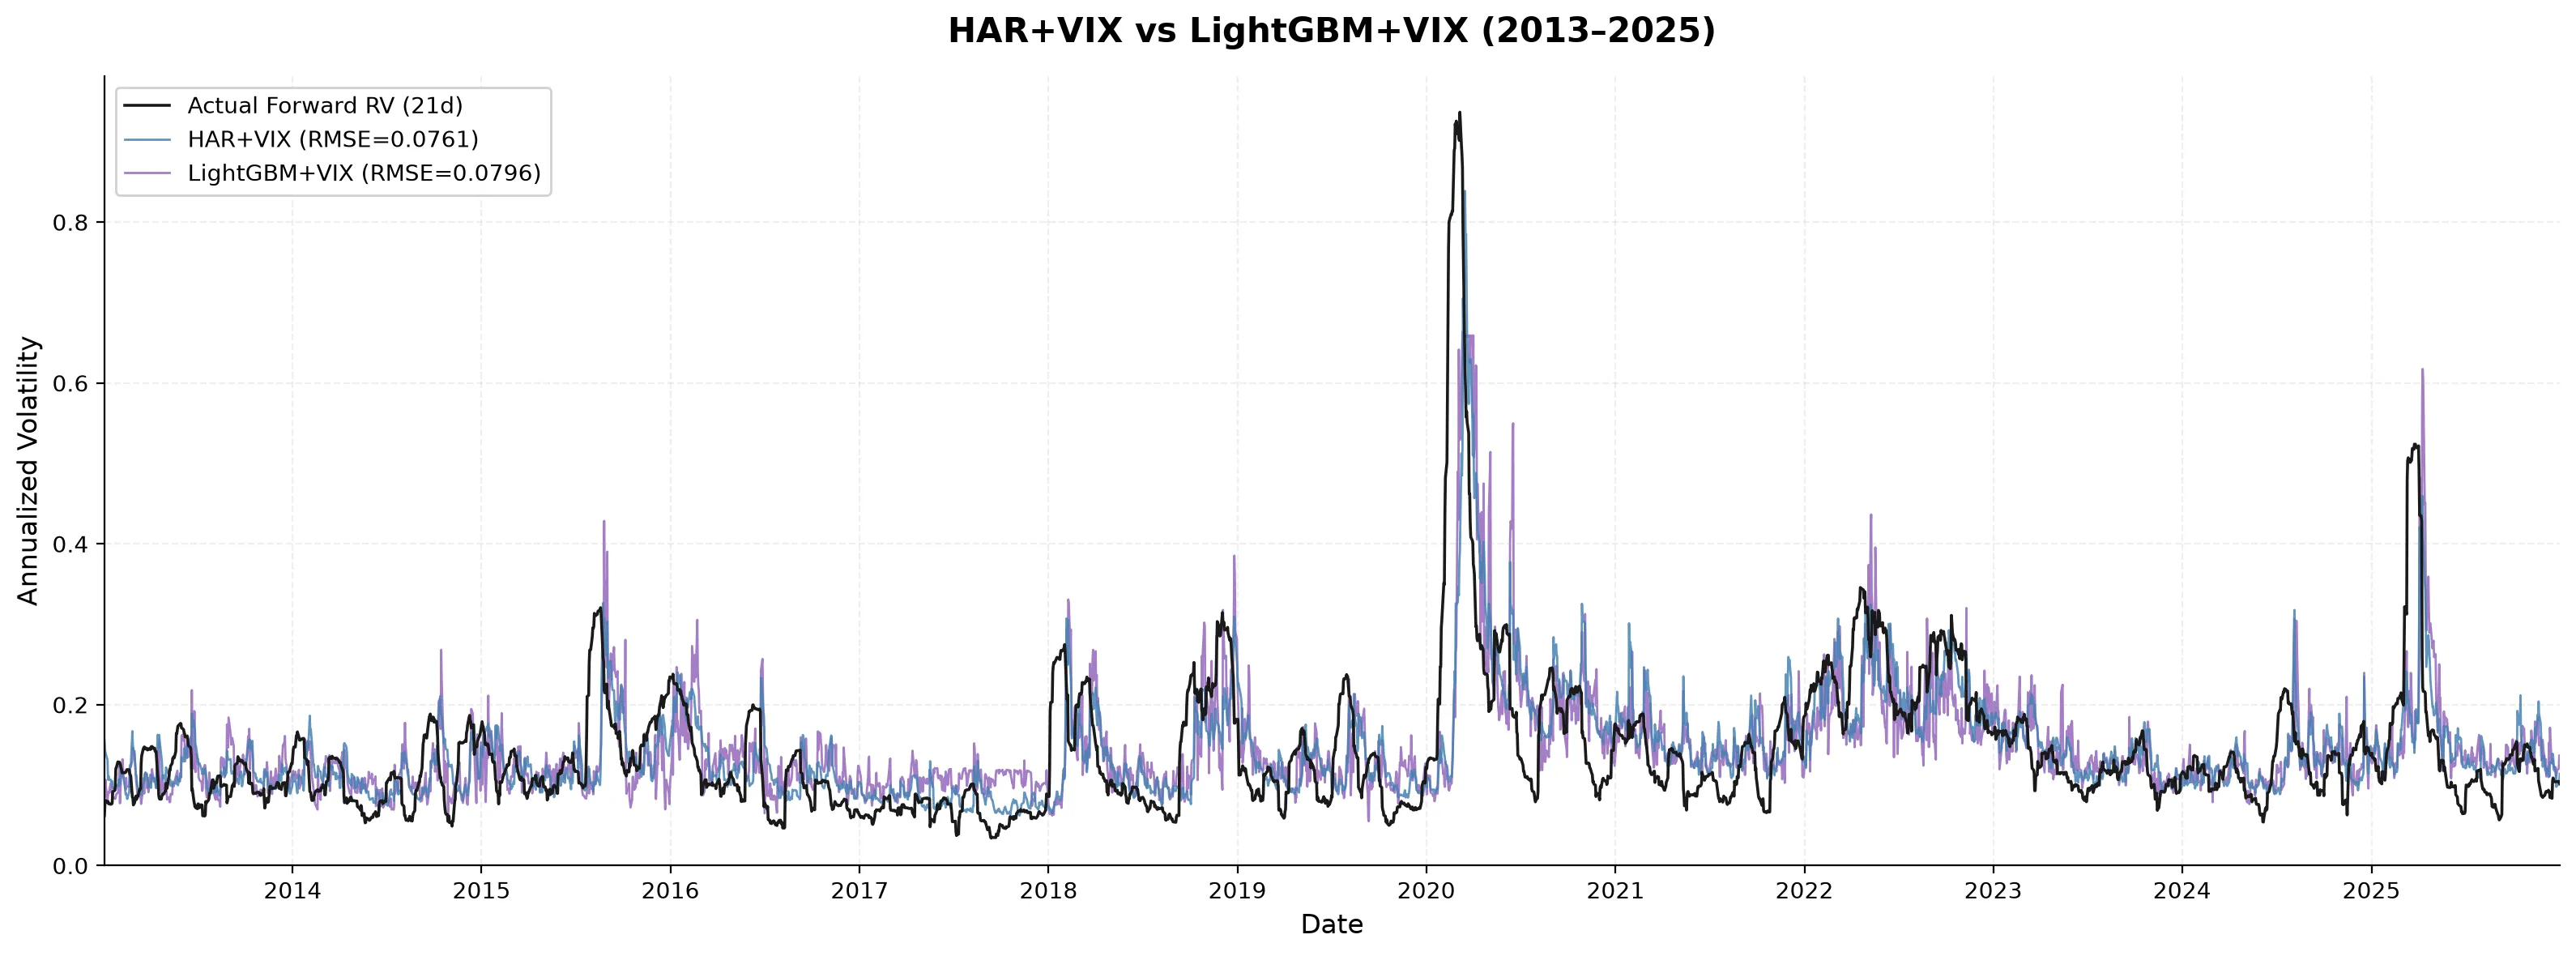
What is HAR-X? Something I learnt after making the mistakes I did. It is an extension of the traditional HAR model with the X standing for exogenous variables, in our case, the VIX values. So with HAR-X, we now pass the same features as we gave LGB, and the results?
RMSE values for tests on data from 2013-latest full calendar data year:
| Model | with just RV | RV + VIx |
|---|---|---|
| HAR | 0.0815 | 0.0761 (best) |
| LGB | 0.0854 | 0.0796 |
HAR-X beats LGB by a good amount, consistently.
So why is this the case?
LGB is a decision tree, and a tree cannot predict for values that it hasn’t seen before. HAR-X is a linear regression model where the weights determine the scaling factor for each feature, so it doesn’t really matter what values it’s seen before.
To put into perspective, if LGB is trained on RV values of 1-100, when it sees an RV value of 150, it assumes it has to predict for the biggest value that it has seen which is 100, so you never really get a true answer. Whereas in HAR, it scales the 150 with the weight assigned to it, so you get a realistic projection of the volatility.
Conclusion
This was a really fun hands-on project that I stumbled upon and started digging into. I didn’t really know anything about these indexes and how volatility can be projected with rolling values of the past activity. I did simulate the same for the Indian market as well, by using NIFTY50 and the India VIX.The answers were the same but I did find that the CBOE VIX consistently overestimates the fear index more than the India VIX does. Wasn’t able to understand why, but it was an interesting finding.
Until next time then.